Debugging Tips
The following page contains some debugging tips you can use to explore udig in action:
What is Going on?
Console Log
It is mentioned in the initial SDK Quickstart but it is worth repeating. When you go to run uDig from inside eclipse switch to the argument tab and add a “-consolelog” argument.
Use the Selection View
The Workbench Selection Tutorial contributes a view allowing you to watch what uDig is doing with selection as it is running. You can quickly include this plugin when running uDig from Eclipse in order to have an extra tool to debug uDig at runtime.
There are many similar eclipse spy programs around on the internet; some watch eclipse startup and tell you who is being slow for example.
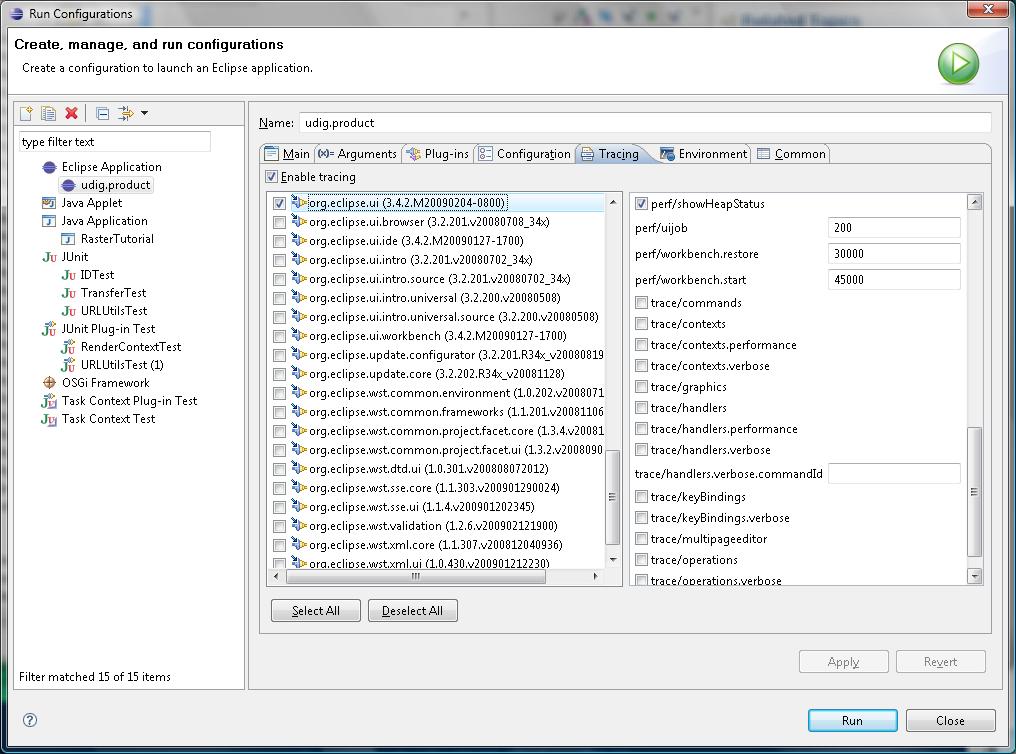
Tracing Specific Plugins
You can turn on tracing for specific plugins; so if you are having trouble with WMS turn on tracing and see what that plugin is doing. The same goes for WFS or Shapefile support. If you are having trouble with plugins starting up you may want to turn on tracking for the eclipse platform plugin - it will provide additional details on how long each plugin takes and if any plugin had trouble.
Note you can also ask end users to perform tracing (you can turn on tracing by adding a file to your workspace rather than using the fancy eclipse Run dialog):
Memory
Heap Monitor
You can turn on the heap monitor widget as a tracing option; this is great trick if you are worried about memory use(and the ability to poke the garbage collector).
A couple of things to watch out for:
- just leaving the JRE running will consume memory (it will compile bytecode into native code when is bored and you are not using the CPU)
- when rendering say a PostGIS layer you can watch the memory use go up; hit the garbage collector button at any time to confirm it is not “holding on” to day. One of the reasons uDig can be fast is that it can use memory when rendering; and put off cleaning up with the garbage collector until after drawing is done
- be careful when you reach the end of your memory rope ... Java does not fail gracefully here - it will run the garbage collector; and then run it again; and again as memory is used up - so running out of memory is not a sudden - but a slow and painful one.
JAI Cache Settings
Right now we have cache settings for the entire application; we need a preference page to allow you to fiddle with the settings for the entire app. Suffice to say that tuning these parameters can have a major impact on the success and speed of raster based operations and rendering.
Using the Debugger
There are many tips to using the debugger; here is some quick advice.
Use binary search with the debugger
If you are having a problem (say dragging and dropping a shapefile) use the debugger like binary search; pick a step halfway between the start of the action (dropping a file) and the end (an addLayer command beeing issued to the map) and see what you can see.
- If the problem already exists - say the file is wrong; you will know to look before your breakpoint (perhaps in the drag and drop code)
- If the problem does not exist (the file is correct) you will know to look after your breakpoint (perhaps in the addLayer code)